As demand for digital infrastructure continues to grow, data centers are becoming an increasingly visible part of the built environment.
While these facilities are essential to modern life — supporting everything from cloud computing to artificial intelligence — they can also raise questions in the communities where they are proposed. Concerns about scale, energy use and local impact often come into focus well before construction begins.
One way to address those concerns is through digital visualization that gives people a clearer understanding of not just what is being built, but how it will look, function and fit within its surroundings.
Visualization specialists work alongside engineers, planners and clients to translate technical designs into visual formats that are easier to interpret.
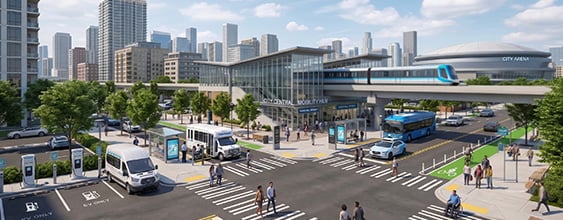
“We visually communicate the project so that people can digest it, rather than relying solely on drawings or descriptions,” said Shawn Jackson, vice president, visualization business development and growth, WSP in the U.S. He said that visualization tools, such as photo simulations and renderings, show what a project will look like in its real-world setting.
Telling the story
This is particularly valuable during the permitting process, where regulators and stakeholders must evaluate how a project will affect its environment.
By combining design specifications with real site imagery, visualization creates a clearer, more accessible picture of a proposed development. It also shapes more informed conversations, from abstract concerns to informed discussion.
“When clients need to tell a story about what they’re trying to achieve, our Visual Studio team helps clients communicate complex technical information in ways that are easier for the public to understand,” said Daniel Krancer, senior vice president of visualization services and business unit director, WSP in the U.S. “When people don’t fully understand what’s proposed, they tend to create their own idea of what the project is, and that’s not always accurate.”
By providing a realistic view of a project, visualization creates a shared understanding that keeps discussions grounded in what is actually being proposed. This can support more efficient permitting by giving regulators and community members a shared understanding of the project from the outset.